Audit trail via OTLP: every agent run as a trace
Prerequisites + catch-up download
Tooling and AWS access common to every post in this series.
Tooling
- Terraform 1.x (install). Every post provisions infrastructure with Terraform.
- uv for Python project management (install). Each post ships a runnable script you can invoke with
uv run. - direnv (install) so
terraform,uv run, andawspick up AWS credentials automatically oncd. The project scaffold ships an.envrcthat sources a gitignored.envrc.local. - (Optional) A coding agent such as Claude Code, Cursor, Codex, or Gemini CLI to consume the
AgentPromptblocks throughout the series. Not required (each prompt has a manual equivalent shown alongside it), but it skips the boilerplate.
Agent prompt: Check and install missing tooling
You are helping set up tooling for a tutorial project.

For each of `terraform`, `uv`, and `direnv`, run `command -v` to
check whether it is installed. If present, print the version and
continue.

For missing tools, detect the system package manager in this order:
`command -v brew`, `command -v dnf`, `command -v apt-get`. Use the
first one available:

  - Terraform: `brew tap hashicorp/tap && brew install hashicorp/tap/terraform`,
    dnf via the HashiCorp RPM repo, or apt via the HashiCorp deb repo.
  - uv: `brew install uv`, or the official installer
    `curl -LsSf https://astral.sh/uv/install.sh | sh`.
  - direnv: `brew install direnv`, `dnf install direnv`, or
    `apt-get install direnv`.

If no package manager is available or the install fails, stop and
link the manual install page so the developer can finish by hand:

  - Terraform: https://developer.hashicorp.com/terraform/install
  - uv: https://docs.astral.sh/uv/getting-started/installation/
  - direnv: https://direnv.net/docs/installation.html

After installing direnv, do not modify any shell rc files. Print the
hook line for the developer's shell (bash, zsh, or fish) and the path
to the relevant rc file, then wait for them to apply it themselves.

Report which tools were already present, which you installed, and
which need manual follow-up.
AWS access
- A sandbox, test, or personal AWS account with permission to create, modify, and delete the resources discussed in each post. If you don’t have one, follow the official Create Your AWS Account walkthrough (about ten minutes; requires a credit card and a phone number for verification). Treat it as disposable - you can close it from the billing console after the series.
- AWS credentials available locally via
aws configure sso,aws configure, or whichever method matches your setup. You wire them into the project through.envrc.localin the next section, not your shell rc.
Anthropic First Time Use
Bedrock requires a one-time use-case form per account (or per AWS Organization management account) before Anthropic models can be invoked. Easiest path: open any Claude model in the Bedrock console playground and submit the form. Auto-subscription on first invoke can take up to 15 minutes to settle, so it is worth clearing this before post 1.
CLI alternative and verification
Programmatic equivalent (requires AWS CLI 2.27.42 or later):
aws bedrock put-use-case-for-model-access \ --form-data "$(printf '{"companyName":"...","companyWebsite":"...","intendedUsers":"1","industryOption":"...","otherIndustryOption":"","useCases":"..."}' | base64)"Verify:
aws bedrock get-foundation-model-availability \ --model-id anthropic.claude-haiku-4-5-20251001-v1:0 \ --region eu-west-1Look for agreementAvailability.status: AVAILABLE. Expected output:
{ "modelId": "anthropic.claude-haiku-4-5-20251001-v1", "agreementAvailability": { "status": "AVAILABLE" }, "authorizationStatus": "AUTHORIZED", "entitlementAvailability": "AVAILABLE", "regionAvailability": "AVAILABLE"}If the form has not been submitted, only agreementAvailability.status flips to NOT_AVAILABLE. The other three fields stay green even when invocation would fail, so do not rely on them.
Project scaffold
Download the cumulative checkpoint that matches the state at the start of this post:
mkdir -p ~/projectscd ~/projectscurl -fsSL https://andreaslang.dev/terraform-pr-agent/terraform-pr-agent-01.tar.gz | tar xzThis contains everything through post 1. If you followed the previous post, your tree should already match; the curl above is for joining mid-series or recovering from drift. Tooling and AWS access from the sections above still apply.
The posts build on each other, so you may need artifacts created by previous posts to be able to run the examples.
Optional: Logfire for the live trace UI
Logfire is the live visualizer we screenshot in the querying section. It is optional: the span processor we set up below only enables the Logfire leg when a write token is present. You can finish the post without it and query the audit copy directly via Athena; the rest of the setup works either way.
If you want it, sign up at logfire.pydantic.dev (GitHub SSO works for the personal
tier), create a project named terraform-pr-agent, then open Project settings -> Write tokens -> New write token.
There is nothing finer-grained to pick: Logfire write tokens are project-scoped write keys by design. They cannot read
telemetry, list other projects, delete the project, or impersonate users, so the blast radius if the token leaks is
“someone can write garbage spans into this one project.” Name the token terraform-pr-agent-collector so it is
obvious what it belongs to, and copy the value immediately (the UI shows it once).
Then add it to .envrc.local and run direnv reload:
export LOGFIRE_TOKEN="pylf_v1_..."If you skip this section, leave LOGFIRE_TOKEN unset. The collector config below uses a Terraform conditional on the
variable being non-empty, so the otlphttp exporter and its IAM permission only materialise when the token is there.
What this post covers
Every agent run becomes an OpenTelemetry trace. We wire pydantic-ai’s instrumentation to an in-process span processor in the Lambda itself, fanning OTLP out to two destinations: an S3 bucket with Object Lock in compliance mode for the immutable audit copy, and Logfire as the live visualizer for debugging the same trace. Logfire is not the system of record. S3 is.
The final tree. + is new in post 2, ~ extends a post 1 file, blank carries unchanged. The download below
fast-forwards to this state if you want to walk through the post against the finished code.
terraform-pr-agent/
  infra/
    + audit-bucket.tf
    + firehose.tf
    + kms.tf
    + lambda.tf
    + logfire.tf
    ~ variables.tf
      alerts.tf
      bedrock.tf
      cloudwatch.tf
      iam.tf
      main.tf
  agent/
    + handler.py
    + __init__.py
  scripts/
    + build-lambda.sh
    + queries.sql
    + traces.sql
      chat.py
  + pyproject.toml
Fast-forward to the final code of this post
Download the cumulative checkpoint that matches the state at the end of this post. Useful for landing on the finished tree without working through every step.
mkdir -p ~/projectscd ~/projectscurl -fsSL https://andreaslang.dev/terraform-pr-agent/terraform-pr-agent-02.tar.gz | tar xzArchitecture
Post 1 was a local script calling Bedrock through an assumed role, with CloudWatch
metrics as the only observation surface. Post 2 wraps that call in a Lambda, adds the dual-sink span pipeline
(logfire to the live UI, an in-memory buffer to Firehose for the audit copy), and stands up the S3-side query
layer on top.
OTLP schema for audit
We do not design a schema ourselves. The OpenTelemetry GenAI semantic conventions
already specify what an agent run looks like as a trace, and pydantic-ai’s Logfire instrumentation emits that shape
for us. Reusing the convention means the same trace renders in Logfire, Jaeger, Tempo, or any OTLP-compatible backend,
and attributes like gen_ai.usage.input_tokens mean the same thing everywhere.
A trace is a tree of spans sharing one trace_id. Each span has a parent, a start and end time, a status, and a bag
of attributes. Per the OTel spec, span names follow {operation} {target}: the agent run becomes a root
invoke_agent span, each LLM call becomes a chat span named after the model, and each tool becomes an
execute_tool span. Pydantic-ai emits these names when you opt into the spec-compliant instrumentation with
logfire.instrument_pydantic_ai(version=5). Rendered as a waterfall in a typical trace UI, one agent run looks like
this:
invoke_agent terraform_pr_agent  ████████████████  4.1s
  chat claude-haiku-4-5          █████             0.9s
  execute_tool write_file             █            0.2s
  chat claude-haiku-4-5                ███         0.6s
  execute_tool terraform_validate         ██       0.3s
Each chat span carries the GenAI attributes that matter: gen_ai.request.model, gen_ai.usage.input_tokens and
output_tokens, gen_ai.input.messages and gen_ai.output.messages (when content recording is on), and
gen_ai.response.finish_reasons. Each execute_tool span carries the tool name, arguments, and result. Concretely:
chat claude-haiku-4-5
  gen_ai.system                  aws.bedrock
  gen_ai.operation.name          chat
  gen_ai.request.model           claude-haiku-4-5
  gen_ai.usage.input_tokens      1247
  gen_ai.usage.output_tokens     312
  gen_ai.response.finish_reasons ["stop"]
  gen_ai.input.messages          [{role: user, parts: [...]}]
  gen_ai.output.messages         [{role: assistant, parts: [...]}]

execute_tool write_file
  gen_ai.operation.name          execute_tool
  gen_ai.tool.name               write_file
  gen_ai.tool.call.id            toolu_01ABC...
  gen_ai.tool.call.arguments     {path: main.tf, content: ...}
  gen_ai.tool.call.result        {ok: true, bytes_written: 412}
That is the free debugger. When a run misbehaves you have a complete record of what the agent saw, what it called, what the call returned, and what it decided next. The pydantic-ai Logfire integration docs list everything emitted by default.
Infra
Variables
The full variables.tf with post 1’s two carried through and three new ones for the audit pipeline (retention
horizon, Parameters-and-Secrets layer ARN, and the Logfire write token):
variable "alert_email" { description = "Email address subscribed to the agent alerts SNS topic. Set via TF_VAR_alert_email." type = string}
variable "daily_token_alarm_threshold" { description = "Daily combined input + output token threshold. Crossing it sends an email via SNS." type = number default = 1000000}
variable "audit_retention_days" { type = number description = "Object Lock default retention in days. Tutorial default is 7 so the bucket is easy to clean up; production audit horizons are typically years (e.g. 2555 for SOX-style controls)." default = 7}
# arm64 build of the AWS Parameters and Secrets Lambda Extension, pinned to eu-west-1.variable "secrets_extension_layer_arn" { type = string description = "ARN of the AWS Parameters and Secrets Lambda Extension layer." default = "arn:aws:lambda:eu-west-1:015030872274:layer:AWS-Parameters-and-Secrets-Lambda-Extension-Arm64:87"}
variable "logfire_token" { type = string description = "Logfire write token. Leave empty to skip the Logfire integration. Set via TF_VAR_logfire_token in .envrc.local." default = "" sensitive = true}The Lambda
Two things in lambda.tf worth pointing at. First, the IAM policy mirrors post 1’s Bedrock invoke perms, then layers
SSM + KMS Decrypt for the Logfire token (gated by dynamic blocks so they only attach when TF_VAR_logfire_token is
set) and firehose:PutRecord on the audit stream:
# trivy:ignore:avd-aws-0057# Bedrock foundation-model ARNs do not pin to the caller region (the inference# profile fans out cross-region), and Marketplace subscription actions are# global by design.data "aws_iam_policy_document" "lambda_permissions" { # Bedrock invocation. Same shape as iam.tf's bedrock_invoke; copied # here so the Lambda role is self-contained and does not require # the user-role policy to also be attached to the Lambda role. statement { actions = [ "bedrock:Converse", "bedrock:ConverseStream", "bedrock:InvokeModel", "bedrock:InvokeModelWithResponseStream", ] # Bedrock foundation-model ARNs do not pin to the caller region; the # inference profile fans out cross-region, so the * region segment is required. #trivy:ignore:avd-aws-0057 resources = [ aws_bedrock_inference_profile.agent.arn, local.system_inference_profile_arn, "arn:aws:bedrock:*::foundation-model/${local.bedrock_model_id}", ] }
statement {39 collapsed lines
actions = [ "aws-marketplace:Subscribe", "aws-marketplace:Unsubscribe", "aws-marketplace:ViewSubscriptions", ] # Marketplace subscription actions are global by design. #trivy:ignore:avd-aws-0057 resources = ["*"] }
# SSM SecureString read for the Logfire token, only when wired. dynamic "statement" { for_each = local.logfire_token_wired ? [1] : [] content { actions = ["ssm:GetParameter"] resources = [aws_ssm_parameter.logfire_token[0].arn] } }
# KMS Decrypt on the AWS-managed SSM key, required to read a # SecureString value through the extension. Only when wired. dynamic "statement" { for_each = local.logfire_token_wired ? [1] : [] content { actions = ["kms:Decrypt"] resources = [ "arn:aws:kms:${data.aws_region.current.region}:${data.aws_caller_identity.current.account_id}:alias/aws/ssm", ] } }
statement { actions = [ "firehose:PutRecord", "firehose:PutRecordBatch", ] resources = [aws_kinesis_firehose_delivery_stream.audit.arn] }}Second, the function attaches the AWS Parameters and Secrets Lambda Extension as a layer. The extension caches SSM
reads inside the Lambda execution environment, so we pay the SSM read cost at most once per cold start. The
archive_file placeholder is a one-line stub that exists only to let Terraform create the function on first apply;
the deploy flow below replaces it. lifecycle.ignore_changes keeps later terraform apply runs from clobbering
deployed code.
resource "aws_lambda_function" "agent" { function_name = "terraform-pr-agent" role = aws_iam_role.lambda.arn runtime = "python3.13" architectures = ["arm64"] handler = "agent.handler.handler" timeout = 60 memory_size = 512
filename = data.archive_file.placeholder.output_path source_code_hash = data.archive_file.placeholder.output_base64sha256
layers = [var.secrets_extension_layer_arn]
tracing_config { mode = "Active" }
environment { variables = merge( { BEDROCK_INFERENCE_PROFILE_ARN = aws_bedrock_inference_profile.agent.arn BEDROCK_MODEL_ID = local.bedrock_model_id PARAMETERS_SECRETS_EXTENSION_CACHE_SIZE = "100" PARAMETERS_SECRETS_EXTENSION_HTTP_PORT = "2773" FIREHOSE_DELIVERY_STREAM = aws_kinesis_firehose_delivery_stream.audit.name }, local.logfire_token_wired ? { LOGFIRE_TOKEN_PARAMETER = local.logfire_token_parameter_name } : {}, ) }
12 collapsed lines
lifecycle { ignore_changes = [ filename, source_code_hash, ] }
depends_on = [ aws_iam_role_policy_attachment.lambda_basic_execution, aws_iam_role_policy.lambda_permissions, ]}KMS and the audit bucket
Our audit bucket gets a dedicated KMS key for SSE-KMS. This allows us to further restrict reads by only allowing certain IAM roles to decrypt the audit bucket’s contents. It also gives us another audit trail via CloudTrail: every Decrypt is logged with the IAM role that requested it. We could also add S3 access logging as another layer, but for this post we skip it to keep the moving parts down.
resource "aws_kms_key" "audit" { description = "Encrypts the terraform-pr-agent audit bucket." enable_key_rotation = true deletion_window_in_days = 7 policy = data.aws_iam_policy_document.audit_kms_key_resource_policy.json}
resource "aws_kms_alias" "audit" { name = "alias/terraform-pr-agent-audit" target_key_id = aws_kms_key.audit.key_id}One common gotcha with KMS is that a key policy (resource policy) is required to enable IAM-based control within the
AWS account of the key (or others if you choose). The key policy below does that. Notice the principal:
arn:aws:iam::<account>:root is AWS’s shorthand for “this account, governed by IAM,” not the literal root user. It’s
how you delegate the key’s authorization to IAM policies, so concrete grants can live on role policies instead of in
the key policy itself.
data "aws_iam_policy_document" "audit_kms_key_resource_policy" { statement { sid = "EnableIAMUserPermissions" actions = ["kms:*"] resources = ["*"] principals { type = "AWS" identifiers = ["arn:aws:iam::${data.aws_caller_identity.current.account_id}:root"] } }}The audit bucket follows a standard setup with versioning enabled and all public access blocked.
# Access logging would require a second bucket and is out of scope: the audit# copy here is the system of record for what the agent did, not for who read it.#trivy:ignore:avd-aws-0089resource "aws_s3_bucket" "audit" { bucket = local.audit_bucket_name object_lock_enabled = true}
resource "aws_s3_bucket_versioning" "audit" { bucket = aws_s3_bucket.audit.id
versioning_configuration { status = "Enabled" }}
resource "aws_s3_bucket_public_access_block" "audit" { bucket = aws_s3_bucket.audit.id block_public_acls = true block_public_policy = true ignore_public_acls = true restrict_public_buckets = true}
resource "aws_s3_bucket_server_side_encryption_configuration" "audit" { bucket = aws_s3_bucket.audit.id
rule { apply_server_side_encryption_by_default { sse_algorithm = "aws:kms" kms_master_key_id = aws_kms_key.audit.arn }
bucket_key_enabled = true }}S3 Object Lock is the actual audit primitive (sometimes called WORM, write-once-read-many). With this config S3
blocks every modification to a locked object, regardless of IAM. We start in GOVERNANCE mode while validating the
pipeline; flip to COMPLIANCE once you’re confident. The difference matters: in GOVERNANCE you can still delete or
shorten retention with s3:BypassGovernanceRetention plus the x-amz-bypass-governance-retention: true header, so
mistakes are recoverable. In COMPLIANCE that escape hatch is gone, not even root can shorten the lock. Lifecycle
expirations also defer until each object’s retention clock runs out (transitions to colder storage classes still
work).
For high-risk systems under the EU AI Act, Article 12 requires automatic event logging over the system’s lifetime and Article 19 sets a six-month minimum retention. Object Lock enforces that retention at the storage layer rather than via IAM policy, which closes the most common gap in cloud audit trails.
Two things this setup does not give you. First, cryptographic chain-of-custody is not mandated by the Act, but if you
ever want tamper-evidence stronger than “the bucket says no”, add signed or hash-chained logs on top. Second, GDPR
right-to-erasure collides with COMPLIANCE-mode retention: anything personal you write to the bucket is locked in for
the full window, so plan what you log about identifiable individuals before turning it on.
# GOVERNANCE leaves the bucket deletable for the tutorial; switch to "COMPLIANCE" in production.resource "aws_s3_bucket_object_lock_configuration" "audit" { bucket = aws_s3_bucket.audit.id
rule { default_retention { mode = "GOVERNANCE" days = var.audit_retention_days } }}Simple logic for the lifecycle policy: after the audit retention period ends the current version expires; S3 adds a delete marker, turning the version that held the data into a noncurrent version. One day later that noncurrent version is permanently deleted, so storage stops being billed.
There’s also a transition to Glacier IR at day 90, which only fires when audit_retention_days > 90.
resource "aws_s3_bucket_lifecycle_configuration" "audit" { bucket = aws_s3_bucket.audit.id
rule { id = "transition-to-glacier-ir" status = "Enabled"
filter {}
transition { days = 90 storage_class = "GLACIER_IR" }
noncurrent_version_transition { noncurrent_days = 90 storage_class = "GLACIER_IR" } }
rule { id = "expire-after-retention" status = "Enabled"
filter {}
expiration { days = var.audit_retention_days }
noncurrent_version_expiration { noncurrent_days = 1 } }}Firehose
The agent runs in Lambda, so in principle it can scale to high concurrency. Firehose handles that cleanly: 100k records/second is far more than we should ever need, and it also handles batching: multiple traces (PutRecord calls) get combined into a single S3 object, avoiding the small-files problem on read.
resource "aws_kinesis_firehose_delivery_stream" "audit" { name = "terraform-pr-agent-audit" destination = "extended_s3"
extended_s3_configuration { role_arn = aws_iam_role.firehose.arn bucket_arn = aws_s3_bucket.audit.arn prefix = "traces/year=!{timestamp:yyyy}/month=!{timestamp:MM}/day=!{timestamp:dd}/hour=!{timestamp:HH}/" error_output_prefix = "errors/!{firehose:error-output-type}/year=!{timestamp:yyyy}/month=!{timestamp:MM}/day=!{timestamp:dd}/" buffering_size = 5 buffering_interval = 60 compression_format = "GZIP"
cloudwatch_logging_options { enabled = true log_group_name = aws_cloudwatch_log_group.firehose.name log_stream_name = aws_cloudwatch_log_stream.firehose_s3.name } }}Firehose needs IAM to write encrypted objects into the audit bucket. The only slightly surprising permission is
s3:PutObjectRetention. S3 evaluates the lock policy on every PutObject and rejects writers that can’t set retention,
even when the value being applied is just the bucket default. That detail surfaces another important fact: the lock
period is persisted at write time, so changing the bucket default later only affects future objects, not existing
ones. This is by design - anything else would undermine the lock.
data "aws_iam_policy_document" "firehose_assume" { statement { actions = ["sts:AssumeRole"] principals { type = "Service" identifiers = ["firehose.amazonaws.com"] } }}
resource "aws_iam_role" "firehose" { name = "terraform-pr-agent-firehose" assume_role_policy = data.aws_iam_policy_document.firehose_assume.json}
data "aws_iam_policy_document" "firehose_permissions" { statement { actions = [ "s3:PutObject", "s3:PutObjectRetention", "s3:GetBucketLocation", "s3:ListBucket", ] # /* is how S3 IAM grants object-scoped actions; bounded to the audit bucket. #trivy:ignore:avd-aws-0057 resources = [ aws_s3_bucket.audit.arn, "${aws_s3_bucket.audit.arn}/*", ] }
statement { actions = [ "kms:GenerateDataKey", "kms:Decrypt", ] resources = [aws_kms_key.audit.arn] }
statement { actions = ["logs:PutLogEvents"] # :* covers log streams inside the named Firehose log group only. #trivy:ignore:avd-aws-0057 resources = ["${aws_cloudwatch_log_group.firehose.arn}:*"] }}
resource "aws_iam_role_policy" "firehose_permissions" { name = "terraform-pr-agent-firehose-permissions" role = aws_iam_role.firehose.id policy = data.aws_iam_policy_document.firehose_permissions.json}Build and deploy
The toy chat.py was a PEP 723 inline script; for Lambda we switch to a proper pyproject.toml:
[project]name = "terraform-pr-agent"version = "0.1.0"description = "The terraform-pr-agent Lambda handler."requires-python = ">=3.13"dependencies = [ "pydantic-ai-slim[bedrock]>=1.106", "logfire>=4.35", "boto3>=1.35",]The build script is the Astral uv-on-Lambda flow: export
the locked deps to a requirements.txt, install them into a target dir with the manylinux2014 platform pinned,
drop agent/ alongside, zip.
#!/usr/bin/env bash# Build a deployable zip for the terraform-pr-agent Lambda.## Runs from anywhere; cd's to the project root (the dir holding# pyproject.toml). Produces build/lambda.zip ready for:## aws lambda update-function-code \# --function-name terraform-pr-agent \# --zip-file fileb://build/lambda.zip## Mirrors the pattern from# https://docs.astral.sh/uv/guides/integration/aws-lambda/set -euo pipefail
cd "$(dirname "$0")/.."
# Make sure the lock is in sync with pyproject.toml before exporting.uv sync --quiet
rm -rf buildmkdir -p build/packages
# Export the locked dependency set so uv pip install can consume it# without re-resolving.uv export --frozen --no-dev --no-editable -o build/requirements.txt
# Install deps for Lambda's runtime. --python-platform forces wheels# compatible with Amazon Linux 2 on arm64 (matches the function's# architectures = ["arm64"]). --no-compile-bytecode keeps the zip small# and avoids spending cold-start cycles on pyc creation.uv pip install \ --no-installer-metadata \ --no-compile-bytecode \ --python-platform aarch64-manylinux2014 \ --python 3.13 \ --target build/packages \ -r build/requirements.txt
# Drop the handler package alongside the installed deps.cp -r agent build/packages/
# Zip from inside the staging dir so paths sit at the zip root.( cd build/packages && zip -qr ../lambda.zip . )
echo "built: $(pwd)/build/lambda.zip ($(du -h build/lambda.zip | cut -f1))"Push the zip and smoke-test:
chmod +x scripts/build-lambda.sh./scripts/build-lambda.shaws lambda update-function-code \ --function-name terraform-pr-agent \ --zip-file fileb://build/lambda.zipaws lambda invoke \ --function-name terraform-pr-agent \ --payload '{"prompt": "Hello"}' \ /tmp/out.jsoncat /tmp/out.jsonIf TF_VAR_logfire_token was set, the trace lands in your Logfire project. If not, the call still succeeds; logfire
just does not ship anywhere.
Wiring pydantic-ai to OTLP
We use the Logfire and OTLP SDKs to wire up the pydantic-ai instrumentation and export into two sinks:
- S3 (for audit)
- Logfire (for traces, optional)
Fetching the Logfire token at first invoke
Lambda secrets are often wired directly into environment variables. AWS recommends against this: env var values are
visible to anyone with read access on the Lambda’s config. Instead, Lambdas should use the Parameters and Secrets
Lambda Extension to read the token from SSM Parameter Store on the first invocation. The utility function below does
that fetch; the layer itself is declared in infra/lambda.tf.
def _fetch_logfire_token() -> str | None: """Read the Logfire token from the Parameters and Secrets extension.
Returns None when no token parameter is configured, so the function runs fine without the Logfire integration. The extension caches the value across invocations, so this is cheap on warm starts. """ parameter_name = os.environ.get("LOGFIRE_TOKEN_PARAMETER") if not parameter_name: return None
session_token = os.environ["AWS_SESSION_TOKEN"]
# safe="" forces urllib to percent-encode the leading and embedded # slashes in a hierarchical parameter name (e.g. /a/b/c -> %2Fa%2Fb%2Fc). # The Parameters and Secrets extension rejects unencoded slashes with # HTTP 400; AWS' own Python sample shows the same %2F-encoded form. url = ( "http://localhost:2773/systemsmanager/parameters/get" f"?name={urllib.parse.quote(parameter_name, safe='')}&withDecryption=true" ) req = urllib.request.Request( url, headers={"X-Aws-Parameters-Secrets-Token": session_token}, ) with urllib.request.urlopen(req, timeout=2) as resp: payload = json.load(resp) return payload["Parameter"]["Value"]During the first invocation we fetch the token and instrument Logfire. This can’t happen at module load time, because the Parameters and Secrets Lambda Extension is not available during Lambda’s INIT phase (when the module is imported).
@cachedef _init_logfire() -> None: """Wire Logfire and the audit span processor once per warm container, on the first INVOKE.
The Parameters and Secrets extension is not ready to serve traffic during the Lambda INIT phase, so the token fetch (and the matching logfire setup) cannot run at module import time. @cache memoises on the empty argument tuple, so this runs exactly once per container and is a no-op on every subsequent invocation. """ token = _fetch_logfire_token() if token: os.environ["LOGFIRE_TOKEN"] = token # head=1.0 and tail=None are today's Logfire defaults; pinned here # because this is an audit pipeline, so every trace must reach S3. # Volume is low (one trace per Lambda invocation) and the audit # requirement outweighs Logfire ingest cost. Splitting the rates # (e.g. 1% to Logfire, 100% to S3) is possible with a small extra # sampler; see the post. logfire.configure( send_to_logfire="if-token-present", sampling=SamplingOptions(head=1.0, tail=None), additional_span_processors=[PerTraceAuditProcessor(_ship_trace)], ) # include_content=True is the pydantic-ai default; pinned because the # audit copy needs the actual prompts, tool args, and responses to be # useful for after-the-fact forensics. If that ever becomes a # compliance problem (PII, secrets in prompts), flip to False and # accept a metadata-only audit trail. logfire.instrument_pydantic_ai(version=5, include_content=True)The per-trace audit processor
OTel has no OnTraceComplete hook; the only signals are on_start and on_end per span. The processor implements
the missing primitive against span.parent is None (root) and a trace_id-keyed buffer - Logfire’s tail sampler
buffers spans by trace_id the same way internally. We do not use SimpleSpanProcessor + InMemorySpanExporter
because the buffer would be module-scoped and might leak across invocations on a warm Lambda container.
class PerTraceAuditProcessor(SpanProcessor): """Buffer spans by trace_id, ship as one batch when the root ends.
The OTel SDK has no `OnTraceComplete` hook, so this implements it against the only signal available: `on_end` fires synchronously and `span.parent is None` on a root. Late children (spans ended on a transport thread after the root has already shipped) are dropped, mirroring logfire's tail sampler. See pydantic/logfire#1034. """
def __init__( self, on_trace_complete: Callable[[Sequence[ReadableSpan]], None], ) -> None: self._on_trace_complete = on_trace_complete self._buffers: dict[int, list[ReadableSpan]] = {} self._shipped: set[int] = set() self._lock = threading.Lock()
def on_end(self, span: ReadableSpan) -> None: if not (span.context and span.context.trace_flags.sampled): return trace_id = span.context.trace_id with self._lock: if trace_id in self._shipped: return self._buffers.setdefault(trace_id, []).append(span) if span.parent is not None: return spans = self._buffers.pop(trace_id) self._shipped.add(trace_id) self._ship(spans)
def force_flush(self, timeout_millis: int = 30000) -> bool: with self._lock: pending = list(self._buffers.values()) self._shipped.update(self._buffers) self._buffers.clear() for spans in pending: self._ship(spans) return True
def shutdown(self) -> None: self.force_flush()
def _ship(self, spans: Sequence[ReadableSpan]) -> None: # Suppress instrumentation around the callback so an instrumented # boto3/requests client inside it does not emit a span that # re-enters on_end for a sibling trace. token = attach(set_value(_SUPPRESS_INSTRUMENTATION_KEY, True)) try: self._on_trace_complete(spans) finally: detach(token)Shipping one trace per Firehose record
Shipping the trace is one put_record call on Firehose.
_firehose = boto3.client("firehose")_DELIVERY_STREAM = os.environ["FIREHOSE_DELIVERY_STREAM"]
def _ship_trace(spans: Sequence[ReadableSpan]) -> None: """Serialise one trace as OTLP-JSON and ship it as a single Firehose record.""" payload = json_format.MessageToJson(encode_spans(spans), indent=None) + "\n" _firehose.put_record( DeliveryStreamName=_DELIVERY_STREAM, Record={"Data": payload.encode("utf-8")}, )Constructing the Bedrock model
The model config is simpler than in post 1: we use the Lambda execution role directly, no assume_role like
chat.py.
_INFERENCE_PROFILE_ARN = os.environ["BEDROCK_INFERENCE_PROFILE_ARN"]_MODEL_ID = os.environ["BEDROCK_MODEL_ID"]
def _build_model() -> BedrockConverseModel: return BedrockConverseModel( _MODEL_ID, settings={"bedrock_inference_profile": _INFERENCE_PROFILE_ARN}, )The handler entry
The handler does three things: ensure Logfire is initialised, pull the prompt off the event, and call
agent.run_sync. Everything else (audit shipping, X-Ray tracing, error surfacing) runs through the per-trace
processor and the Logfire SDK - there is no try/except in the handler; failures propagate as Lambda 5xx, and the
audit copy is shipped from the processor’s on_end at root close, before the exception unwinds.
class HandlerEvent(TypedDict): prompt: NotRequired[str]
class HandlerResponse(TypedDict): status: str output: str
def handler(event: HandlerEvent, context: object) -> HandlerResponse: """Lambda entry point.
Falls back to a default prompt so the function can be smoke-tested with an empty payload.
The audit copy ships from inside PerTraceAuditProcessor.on_end when the agent's root span closes, so the handler does not need a finally block: a Firehose failure raises on the same thread as agent.run_sync and propagates as a Lambda 5xx. A failed agent run also closes its root span (with status=ERROR) before the exception unwinds, so the partial trace still ships. """ _init_logfire() prompt = event.get("prompt", "Say hello.") result = agent.run_sync(prompt) return { "status": "ok", "output": str(result.output), }The full file:
"""AWS Lambda handler for the terraform-pr-agent.
First invocation:- Reads the Logfire token from SSM via the Parameters and Secrets Lambda Extension at http://localhost:2773 when LOGFIRE_TOKEN_PARAMETER is set in the env; sets LOGFIRE_TOKEN so the logfire SDK picks it up.- Configures logfire with send_to_logfire="if-token-present" and registers PerTraceAuditProcessor, a custom OTel SpanProcessor that buffers spans by trace_id and ships one OTLP-JSON Firehose record when the trace's root span ends.- Instruments pydantic-ai with version=5 for the spec-compliant span names (invoke_agent, chat, execute_tool) and current GenAI semantic conventions. Pinned explicitly so the schema readers see in the audit copy stays stable across pydantic-ai releases.
The extension's HTTP server rejects requests during INIT with a"not ready to serve traffic" 400, so this work runs on the firstINVOKE and is memoised with @cache for subsequent warm invocations.
Handler:- Reads `prompt` from the invocation event.- Runs the agent synchronously and returns the structured output.
The audit copy lands in Firehose from inside the processor's on_endwhen the agent root span closes, so the handler has no flush logic.A Firehose-side failure raises on the same thread as agent.run_syncand propagates as a Lambda 5xx; the system-of-record copy is neversilently dropped."""
from __future__ import annotations
import jsonimport osimport threadingimport urllib.parseimport urllib.requestfrom collections.abc import Callable, Sequencefrom functools import cachefrom typing import NotRequired, TypedDict
import boto3import logfirefrom google.protobuf import json_formatfrom logfire.sampling import SamplingOptionsfrom opentelemetry.context import ( _SUPPRESS_INSTRUMENTATION_KEY, attach, detach, set_value,)from opentelemetry.exporter.otlp.proto.common._internal.trace_encoder import ( encode_spans,)from opentelemetry.sdk.trace import ReadableSpan, SpanProcessorfrom pydantic_ai import Agentfrom pydantic_ai.models.bedrock import BedrockConverseModel
def _fetch_logfire_token() -> str | None: """Read the Logfire token from the Parameters and Secrets extension.
Returns None when no token parameter is configured, so the function runs fine without the Logfire integration. The extension caches the value across invocations, so this is cheap on warm starts. """ parameter_name = os.environ.get("LOGFIRE_TOKEN_PARAMETER") if not parameter_name: return None
session_token = os.environ["AWS_SESSION_TOKEN"]
# safe="" forces urllib to percent-encode the leading and embedded # slashes in a hierarchical parameter name (e.g. /a/b/c -> %2Fa%2Fb%2Fc). # The Parameters and Secrets extension rejects unencoded slashes with # HTTP 400; AWS' own Python sample shows the same %2F-encoded form. url = ( "http://localhost:2773/systemsmanager/parameters/get" f"?name={urllib.parse.quote(parameter_name, safe='')}&withDecryption=true" ) req = urllib.request.Request( url, headers={"X-Aws-Parameters-Secrets-Token": session_token}, ) with urllib.request.urlopen(req, timeout=2) as resp: payload = json.load(resp) return payload["Parameter"]["Value"]
class PerTraceAuditProcessor(SpanProcessor): """Buffer spans by trace_id, ship as one batch when the root ends.
The OTel SDK has no `OnTraceComplete` hook, so this implements it against the only signal available: `on_end` fires synchronously and `span.parent is None` on a root. Late children (spans ended on a transport thread after the root has already shipped) are dropped, mirroring logfire's tail sampler. See pydantic/logfire#1034. """
def __init__( self, on_trace_complete: Callable[[Sequence[ReadableSpan]], None], ) -> None: self._on_trace_complete = on_trace_complete self._buffers: dict[int, list[ReadableSpan]] = {} self._shipped: set[int] = set() self._lock = threading.Lock()
def on_end(self, span: ReadableSpan) -> None: if not (span.context and span.context.trace_flags.sampled): return trace_id = span.context.trace_id with self._lock: if trace_id in self._shipped: return self._buffers.setdefault(trace_id, []).append(span) if span.parent is not None: return spans = self._buffers.pop(trace_id) self._shipped.add(trace_id) self._ship(spans)
def force_flush(self, timeout_millis: int = 30000) -> bool: with self._lock: pending = list(self._buffers.values()) self._shipped.update(self._buffers) self._buffers.clear() for spans in pending: self._ship(spans) return True
def shutdown(self) -> None: self.force_flush()
def _ship(self, spans: Sequence[ReadableSpan]) -> None: # Suppress instrumentation around the callback so an instrumented # boto3/requests client inside it does not emit a span that # re-enters on_end for a sibling trace. token = attach(set_value(_SUPPRESS_INSTRUMENTATION_KEY, True)) try: self._on_trace_complete(spans) finally: detach(token)
_firehose = boto3.client("firehose")_DELIVERY_STREAM = os.environ["FIREHOSE_DELIVERY_STREAM"]
def _ship_trace(spans: Sequence[ReadableSpan]) -> None: """Serialise one trace as OTLP-JSON and ship it as a single Firehose record.""" payload = json_format.MessageToJson(encode_spans(spans), indent=None) + "\n" _firehose.put_record( DeliveryStreamName=_DELIVERY_STREAM, Record={"Data": payload.encode("utf-8")}, )
@cachedef _init_logfire() -> None: """Wire Logfire and the audit span processor once per warm container, on the first INVOKE.
The Parameters and Secrets extension is not ready to serve traffic during the Lambda INIT phase, so the token fetch (and the matching logfire setup) cannot run at module import time. @cache memoises on the empty argument tuple, so this runs exactly once per container and is a no-op on every subsequent invocation. """ token = _fetch_logfire_token() if token: os.environ["LOGFIRE_TOKEN"] = token # head=1.0 and tail=None are today's Logfire defaults; pinned here # because this is an audit pipeline, so every trace must reach S3. # Volume is low (one trace per Lambda invocation) and the audit # requirement outweighs Logfire ingest cost. Splitting the rates # (e.g. 1% to Logfire, 100% to S3) is possible with a small extra # sampler; see the post. logfire.configure( send_to_logfire="if-token-present", sampling=SamplingOptions(head=1.0, tail=None), additional_span_processors=[PerTraceAuditProcessor(_ship_trace)], ) # include_content=True is the pydantic-ai default; pinned because the # audit copy needs the actual prompts, tool args, and responses to be # useful for after-the-fact forensics. If that ever becomes a # compliance problem (PII, secrets in prompts), flip to False and # accept a metadata-only audit trail. logfire.instrument_pydantic_ai(version=5, include_content=True)
_INFERENCE_PROFILE_ARN = os.environ["BEDROCK_INFERENCE_PROFILE_ARN"]_MODEL_ID = os.environ["BEDROCK_MODEL_ID"]
def _build_model() -> BedrockConverseModel: return BedrockConverseModel( _MODEL_ID, settings={"bedrock_inference_profile": _INFERENCE_PROFILE_ARN}, )
SYSTEM_PROMPT = ( "You are the terraform-pr-agent. For now you are a placeholder; " "respond briefly to whatever prompt you are given.")
agent = Agent(_build_model(), system_prompt=SYSTEM_PROMPT)
class HandlerEvent(TypedDict): prompt: NotRequired[str]
class HandlerResponse(TypedDict): status: str output: str
def handler(event: HandlerEvent, context: object) -> HandlerResponse: """Lambda entry point.
Falls back to a default prompt so the function can be smoke-tested with an empty payload.
The audit copy ships from inside PerTraceAuditProcessor.on_end when the agent's root span closes, so the handler does not need a finally block: a Firehose failure raises on the same thread as agent.run_sync and propagates as a Lambda 5xx. A failed agent run also closes its root span (with status=ERROR) before the exception unwinds, so the partial trace still ships. """ _init_logfire() prompt = event.get("prompt", "Say hello.") result = agent.run_sync(prompt) return { "status": "ok", "output": str(result.output), }Querying traces
DuckDB on your laptop
The audit copy is GZIP’d OTLP-JSON under a Hive-partitioned prefix. Anything that reads NDJSON over S3 can query it; for
a single-laptop workflow the lightest option is DuckDB. Install it once (brew install duckdb on macOS; see the
install guide for other platforms).
The view reads the bucket name from AUDIT_BUCKET in your shell (via DuckDB’s CLI-only getenv()), so park that
alongside AWS_PROFILE in .envrc.local and let direnv export both on every cd:
# Bucket name for the audit copy. The DuckDB view in scripts/traces.sql# reads it via the CLI-only getenv() function so the SQL stays free of# account-specific values.export AUDIT_BUCKET=terraform-pr-agent-audit-$(aws sts get-caller-identity --query Account --output text)-${AWS_REGION}Then opening the local database file is a one-liner:
duckdb traces.duckdbFirst session only, create a persistent S3 secret and a view that flattens the OTLP shape into the columns you actually
want. Paste this in (or .read it from a saved file):
CREATE PERSISTENT SECRET ( TYPE s3, PROVIDER credential_chain, REFRESH auto);SET VARIABLE audit_bucket = getenv('AUDIT_BUCKET');
-- hive_partitioning = true reads year=YYYY/month=MM/day=DD/ from the-- object path as virtual columns, so the partition predicate in a-- query below prunes objects before any file is opened.CREATE OR REPLACE VIEW traces ASWITH spans AS ( -- Flatten the OTLP-JSON envelope into one row per span, with the -- common span fields lifted out as named columns so downstream -- CTEs and ad-hoc queries can work against `name`, `trace_id`, -- `dur_ms`, etc. without re-doing the struct navigation each time. SELECT year, month, day, span.name AS name, lower(hex(from_base64(span.traceId::VARCHAR))) AS trace_id, lower(hex(from_base64(span.spanId::VARCHAR))) AS span_id, lower(hex(from_base64(span.parentSpanId::VARCHAR))) AS parent_span_id, make_timestamp_ns(span.startTimeUnixNano::BIGINT) AS started, make_timestamp_ns(span.endTimeUnixNano::BIGINT) AS ended, (span.endTimeUnixNano::BIGINT - span.startTimeUnixNano::BIGINT) / 1e6 AS dur_ms, span.status.code::VARCHAR AS status_code, span.attributes AS attributes, data.filename AS source_file, -- Firehose names objects <stream>-<ver>-<YYYY-MM-DD-HH-MM-SS>-<uuid>.gz; -- stripping the trailing -<uuid>.gz collapses rows from the same flush -- batch onto a stable key for grouping. regexp_replace( split_part(data.filename, '/', -1), '-[0-9a-f]{8}-[0-9a-f]{4}-[0-9a-f]{4}-[0-9a-f]{4}-[0-9a-f]{12}\.gz$', '' ) AS batch_key FROM read_ndjson( 's3://' || getvariable('audit_bucket') || '/traces/**/*.gz', compression = 'gzip', hive_partitioning = true, filename = true) AS data , UNNEST(data.resourceSpans) AS u1(rs) , UNNEST(rs.scopeSpans) AS u2(ss) , UNNEST(ss.spans) AS u3(span)),roots AS ( -- One row per trace: the invoke_agent root span pydantic-ai emits per run. SELECT * FROM spans WHERE parent_span_id IS NULL OR parent_span_id = ''),chats AS ( -- Per-trace summary of the LLM call: pulls the GenAI semantic -- convention attributes off the chat span and exposes each as a -- named column. SELECT trace_id, list_filter(attributes, x -> x.key = 'gen_ai.system')[1].value.stringValue AS gen_ai_system, list_filter(attributes, x -> x.key = 'gen_ai.operation.name')[1].value.stringValue AS operation, list_filter(attributes, x -> x.key = 'gen_ai.request.model')[1].value.stringValue AS request_model, list_filter(attributes, x -> x.key = 'gen_ai.response.model')[1].value.stringValue AS response_model, list_filter(attributes, x -> x.key = 'gen_ai.usage.input_tokens')[1].value.intValue::BIGINT AS in_tokens, list_filter(attributes, x -> x.key = 'gen_ai.usage.output_tokens')[1].value.intValue::BIGINT AS out_tokens, list_filter(attributes, x -> x.key = 'gen_ai.response.finish_reasons')[1] .value.arrayValue.values[1].stringValue AS finish, list_filter(attributes, x -> x.key = 'gen_ai.conversation.id')[1].value.stringValue AS conversation_id, list_filter(attributes, x -> x.key = 'gen_ai.agent.name')[1].value.stringValue AS agent_name, list_filter(attributes, x -> x.key = 'gen_ai.agent.call.id')[1].value.stringValue AS agent_call_id, list_filter(attributes, x -> x.key = 'gen_ai.input.messages')[1].value.stringValue AS input_messages, list_filter(attributes, x -> x.key = 'gen_ai.output.messages')[1].value.stringValue AS output_messages FROM spans WHERE name LIKE 'chat %')SELECT roots.started, roots.year, roots.month, roots.day, roots.trace_id, substr(roots.trace_id, 1, 8) AS trace, roots.batch_key, roots.source_file, roots.dur_ms, regexp_extract(chats.request_model, '[^./]+$') AS model, chats.in_tokens, chats.out_tokens, chats.finish, chats.agent_name, chats.conversation_id, -- Convenience columns for the common single-turn shape: system at -- input[0], user at input[1], assistant at output[0]. Multi-turn -- runs invalidate the indices, so reach for input_messages and -- output_messages directly for those. json_extract_string(chats.input_messages, '$[0].parts[0].content') AS system_prompt, json_extract_string(chats.input_messages, '$[1].parts[0].content') AS user_prompt, json_extract_string(chats.output_messages, '$[0].parts[0].content') AS assistant_response, chats.input_messages, chats.output_messages, -- Per the OTel spec, instrumentation libraries leave status unset -- on success (only application code may set it to Ok). Every OTel -- backend treats unset as "no error reported"; we render the same. CASE roots.status_code WHEN 'STATUS_CODE_ERROR' THEN 'err' ELSE 'ok' END AS statusFROM rootsJOIN chats USING (trace_id);After that, every later duckdb traces.duckdb session lands you in a shell where the view is already there. One
caveat: the view body references getvariable('audit_bucket'), and SET VARIABLE is session-scoped, so a fresh
session needs the variable re-set before any SELECT against traces will run. The simplest fix is to .read scripts/traces.sql again at the top of each session - CREATE OR REPLACE VIEW is idempotent, and the same script
sets the variable. Hive partitioning means year, month, and day are real columns DuckDB prunes on before
opening any object:
SELECT *FROM tracesWHERE year = 2026 AND month = 6 AND day = 8ORDER BY started DESC;
-- Example output (narrowed to 7 of the view's 18 columns; SELECT * also-- returns conversation_id, system_prompt, user_prompt, assistant_response,-- input_messages, output_messages, status, batch_key, source_file,-- year/month/day):---- ┌───────────────────────────────┬──────────┬────────────────────────────────┬─────────────┬───────────┬────────────┬────────┐-- │ started │ trace │ model │ dur_ms │ in_tokens │ out_tokens │ finish │-- ├───────────────────────────────┼──────────┼────────────────────────────────┼─────────────┼───────────┼────────────┼────────┤-- │ 2026-06-08 20:31:06.044709547 │ 019ea8ee │ claude-haiku-4-5-20251001-v1:0 │ 6815.733257 │ 36 │ 59 │ stop │-- │ 2026-06-08 20:31:05.984812728 │ 019ea8ee │ claude-haiku-4-5-20251001-v1:0 │ 1459.186377 │ 36 │ 38 │ stop │-- │ 2026-06-08 20:31:05.964196348 │ 019ea8ee │ claude-haiku-4-5-20251001-v1:0 │ 2024.133412 │ 36 │ 123 │ stop │-- │ 2026-06-08 20:31:05.944446527 │ 019ea8ee │ claude-haiku-4-5-20251001-v1:0 │ 1581.984687 │ 36 │ 50 │ stop │-- │ 2026-06-08 20:31:05.926721468 │ 019ea8ee │ claude-haiku-4-5-20251001-v1:0 │ 1480.496671 │ 36 │ 43 │ stop │-- └───────────────────────────────┴──────────┴────────────────────────────────┴─────────────┴───────────┴────────────┴────────┘SELECT day, count(*) AS runsFROM tracesWHERE year = 2026 AND month = 6GROUP BY dayORDER BY day;
-- Example output:---- ┌─────┬──────┐-- │ day │ runs │-- ├─────┼──────┤-- │ 04 │ 2 │-- │ 08 │ 11 │-- │ 09 │ 1 │-- └─────┴──────┘SELECT day, sum(in_tokens) AS input_tokens, sum(out_tokens) AS output_tokensFROM tracesWHERE year = 2026GROUP BY dayORDER BY day;
-- Example output:---- ┌─────┬──────────────┬───────────────┐-- │ day │ input_tokens │ output_tokens │-- ├─────┼──────────────┼───────────────┤-- │ 04 │ 80 │ 43 │-- │ 08 │ 397 │ 605 │-- │ 09 │ 38 │ 145 │-- └─────┴──────────────┴───────────────┘The view is the interface; everything downstream is normal SQL against a traces table that happens to live in S3. The
partition predicates are the same shape the Athena section below uses.
The local traces.duckdb only holds the view DDL and the cached S3 secret. Trace data is streamed from the bucket on
every SELECT via httpfs, not copied locally.
Athena/Snowflake
DuckDB is the simplest choice for the post, but every query pulls bytes to your laptop. Because the bucket is Hive-partitioned, the same query shape works in Athena or Snowflake with no schema rebuild.
Reference:
- AWS docs: Athena partition projection for Firehose data.
CREATE EXTERNAL TABLEwithprojection.*properties and astorage.location.templateinfers partitions from theyear=YYYY/month=MM/day=DD/hour=HH/path at query time, so there is no Glue crawler to schedule or partitions to register as new objects land. - Snowflake docs: creating an S3 stage. Create an external stage defining JSON format.
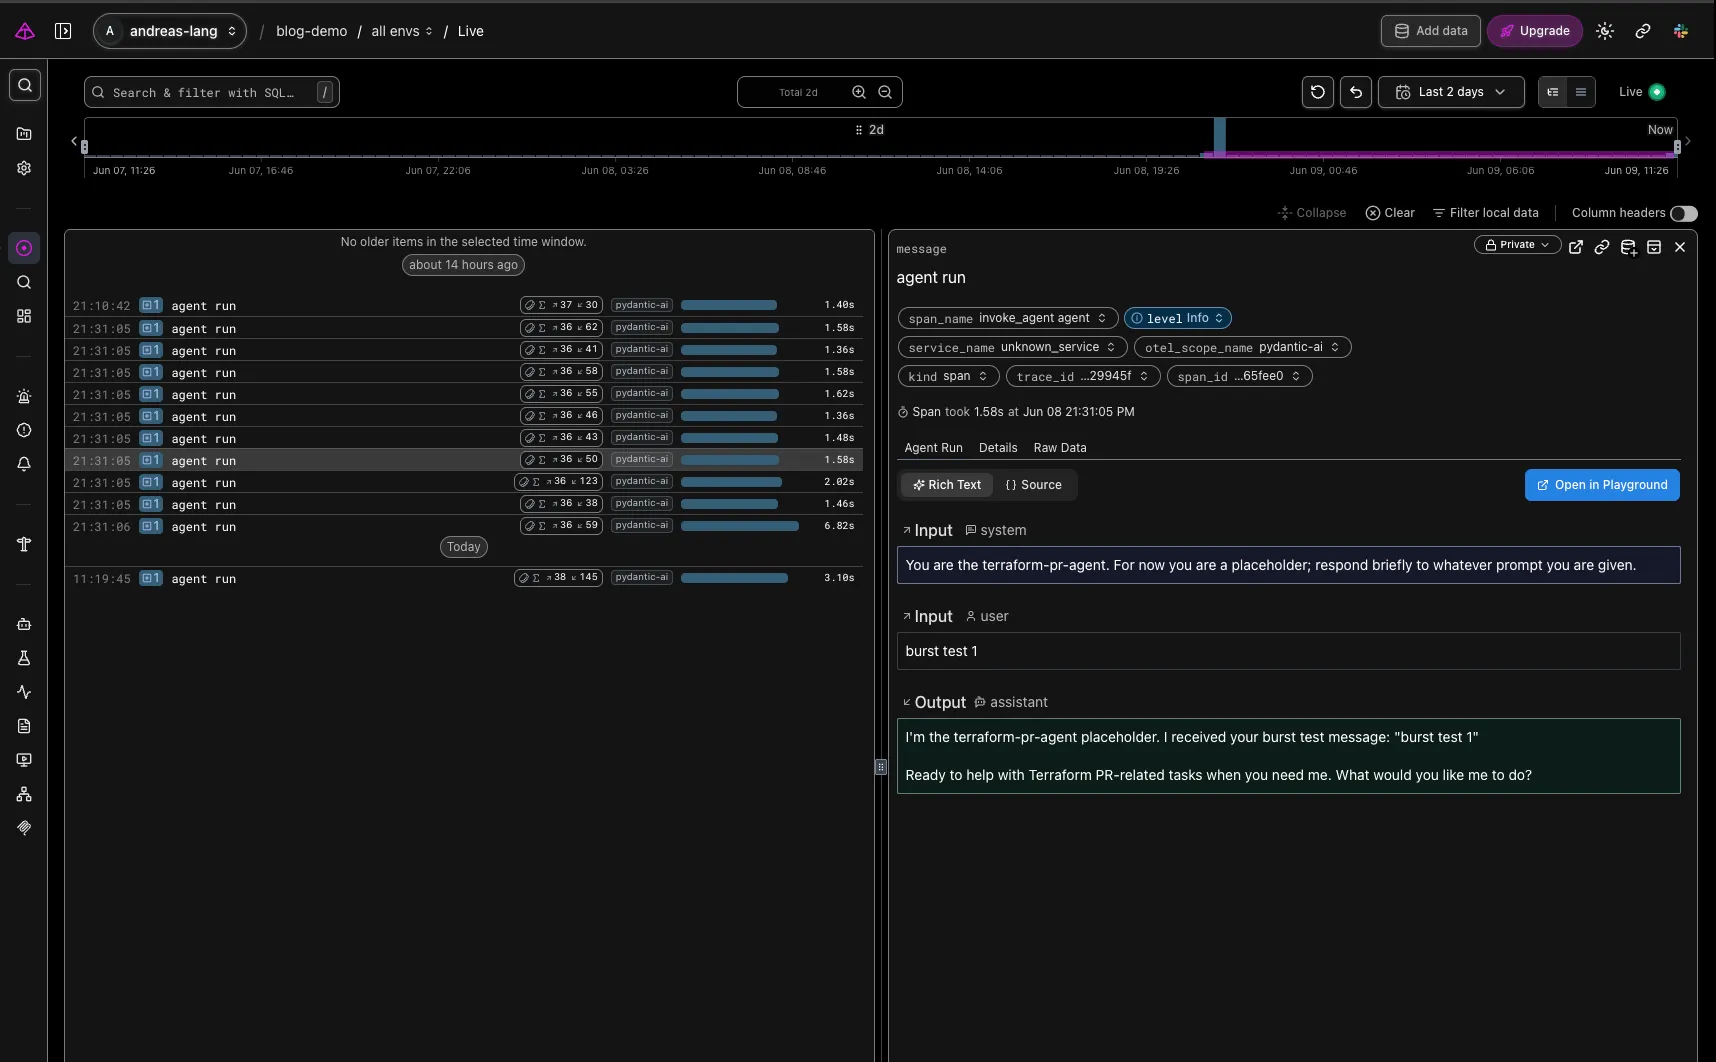
The same trace in Logfire
The same data as above can be viewed independently in the Logfire SaaS platform if you signed up and created a token. You can see in the screenshot that System Prompt, User Prompt, and Output of the agent have been captured.
End state
Every agent run lands in S3 as an immutable OTel trace, with full input/output messages, tool calls, retries, and token usage captured. Athena queries the audit copy when you need to answer compliance questions; Logfire renders the same trace live when you need to debug. The next four posts build retries, conventions, evals, and the PR flow on top of these traces; everything they do shows up in the trace tree without further audit plumbing.
Coming next: workspace and small toolkit for the agent to get to work.